The modern CISO has a communication problem. You go to the board with a heat map showing a "Red" risk in cloud security. The CFO asks, "How much will that cost us if it breaks?" You say, "It's critical." They say, "Is that $100,000 bad or $100 million bad?"
If you cannot answer that question, you are not managing risk. You are managing technical debt.
Technical leaders often complain that the board doesn't understand security. The reality is that security leaders often don't understand business. The lingua franca of the boardroom is not CVSS scores or patch latency; it is Annual Loss Expectancy (ALE).
This guide details how to burn your heat maps and build a financial risk model that survives scrutiny from the audit committee.
Why the "red/yellow/green" heatmap is dead
Heat maps provide the illusion of communication without the substance of risk.
A Reddit discussion on CISO reporting identified a critical failure mode: "Compliance creates false confidence." When you report that 95% of servers are patched, the board hears "We are safe." They do not hear "The 5% unpatched servers are our crown jewel databases."
Subjective risk assessments collapse under pressure because they lack a common unit of measure.
The "heatmap vs. dollar" maturity matrix
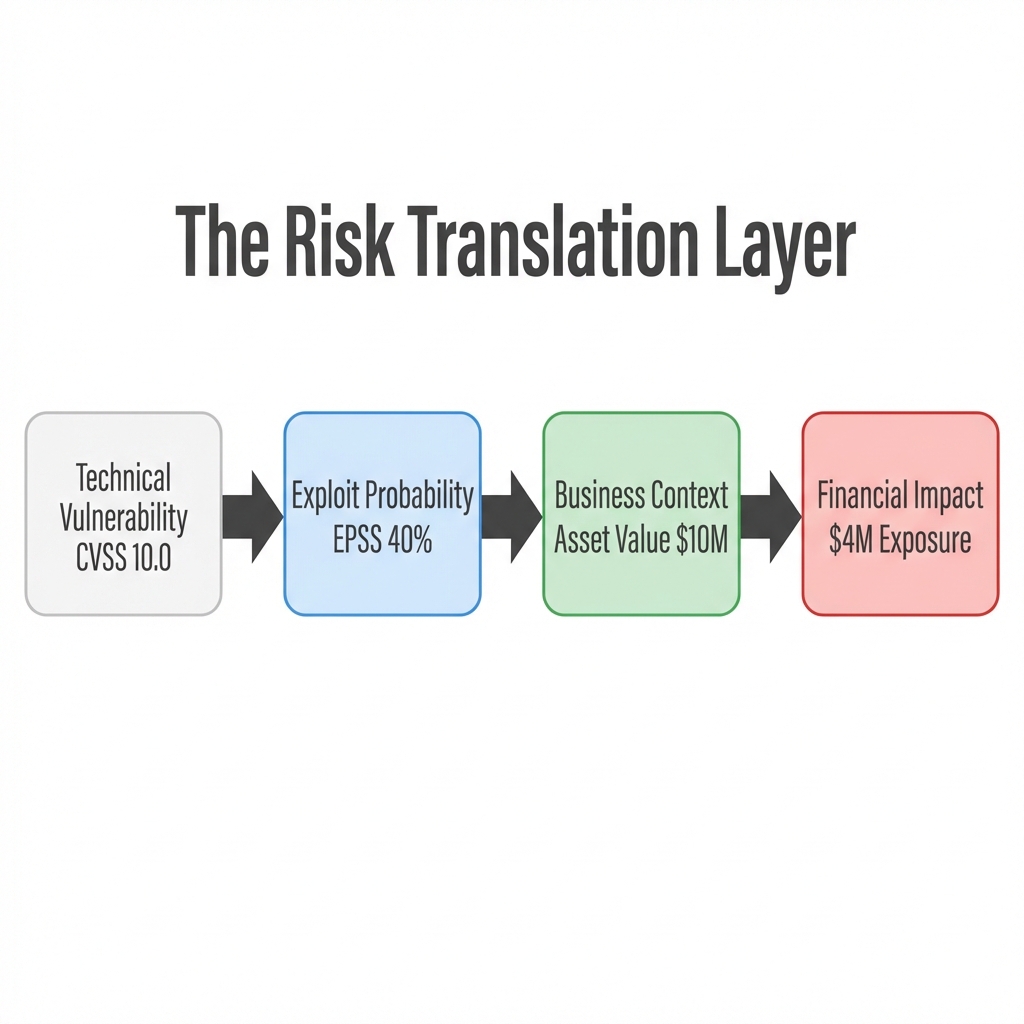
Figure 1: The Risk Translation Layer - Converting Tech Specs to Board Specs
Qualitative models fail because "Red" means different things to different people. A "Red" risk to an engineer might mean a server is down. A "Red" risk to a CFO means the quarterly earnings call is cancelled.
| Feature | Qualitative (Heatmaps) | Quantitative (CRQ/FAIR) |
|---|---|---|
| Output | "High Risk" (Red Color) | "$5.2M Annual Loss Exposure" |
| Board Reaction | "Is 'Red' bad? How bad?" | "Is $5M within our risk appetite?" |
| Decision Support | Vague ("We need a firewall") | Precise ("Spending $100k saves $2M") |
| Input Data | Subjective Opinion | Historical Loss Data + Monte Carlo |
| 2026 Viability | Obsolete | Mandatory |
What is cyber risk quantification (CRQ)?
CRQ moves from measuring activity (scans run, alerts closed) to measuring liability.
This shift is driven by new SEC disclosure rules and the insurance market. Reports like the Marsh Q4 2024 Cyber Market Update show that insurers now demand evidence of "risk management maturity", essentially proving your math, before writing manageable premiums.
If you cannot quantify your risk, you cannot insure it. And if you cannot insure it, you are self-insuring it without knowing the price tag.
How do we calculate annual loss expectancy (ALE)?
You do not need a PhD in statistics to measure financial risk. You need the standard actuarial formula used by the insurance industry.
Single Loss Expectancy (SLE) is the total monetary loss from a single event. This includes direct costs like ransom payments and hardware replacement, indirect costs like downtime (revenue per hour * hours down), and liability costs including legal fees and GDPR/CCPA fines.
Annualized Rate of Occurrence (ARO) is the probability of the event happening in a year (e.g., 0.1 for once every 10 years).
Using Monte Carlo simulations
A static number is often wrong. You cannot say a breach will cost exactly $1.5 million. It might cost $500k, or it might cost $10 million.
We use Monte Carlo simulations to run the scenario 10,000 times with random variables. This gives you a probability distribution (a bell curve).
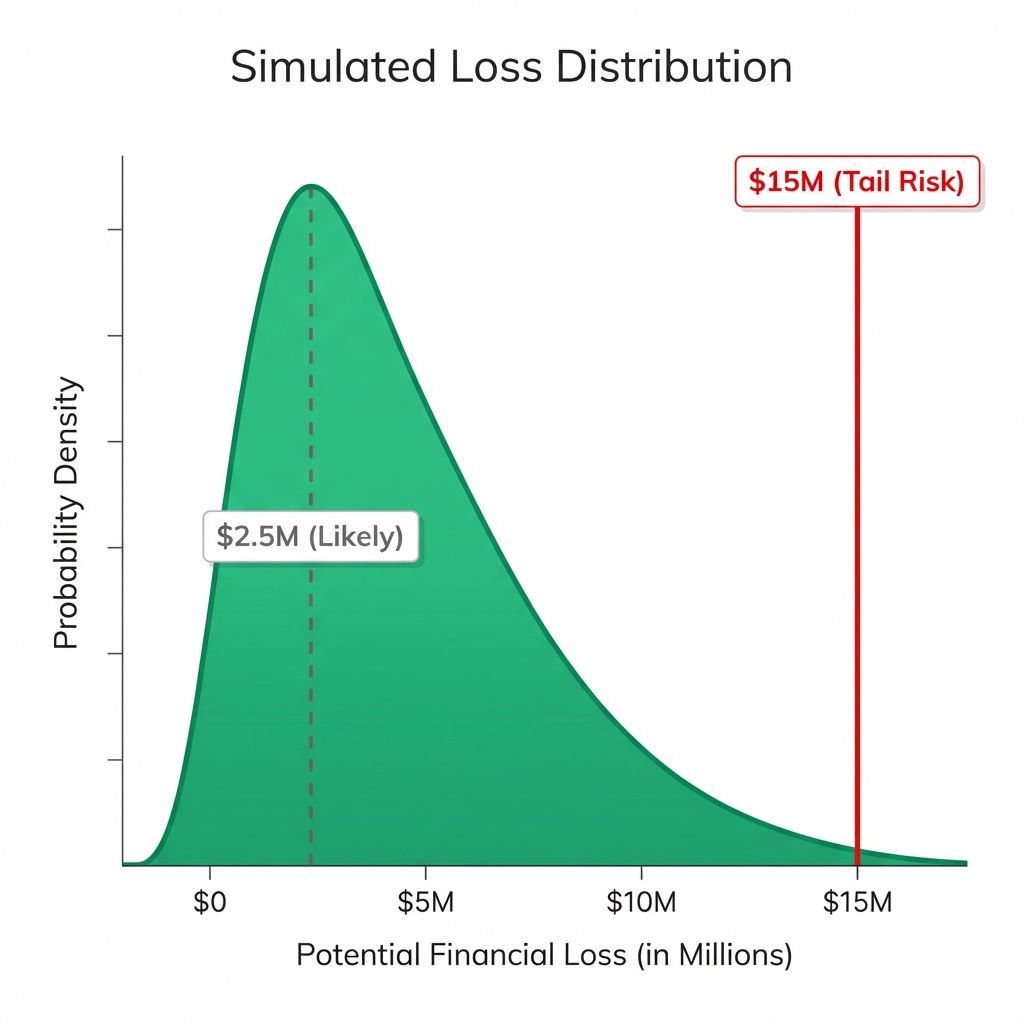
Figure 2: Simulated Loss Distribution (n=10,000)
Examples of how to present this to the board:
- Most Likely Case: $2.5M loss (50% probability).
- Tail Risk (Black Swan): $15M loss (90% confident it won't exceed this).
FAIR vs. bowtie: which model fits your board?
Two primary models dominate the CRQ landscape. Choosing the wrong one will alienate your audience.
The FAIR model (Factor analysis of information risk)
Best for the CFO and the Audit Committee. It focuses on pure financial rigor, breaking risk down into "Loss Event Frequency" and "Loss Magnitude." While it provides defensible numbers, the high complexity requires significant data to work well.
The bowtie method
Best for the CTO and Engineering Leadership. It focuses on the "Attack Path," visualizing the threat on the left, the event in the center, and the consequences on the right. It is easy to visualize how controls stop an attack, but offers less financial precision.
Verdict: Use Bowtie to explain what happened. Use FAIR to explain how much it costs.
Top 3 challenges in implementing CRQ
The "garbage in" problem (Data quality)
Models are only as good as their inputs. If your Asset Inventory is only 60% complete, your risk model is 40% blind. You cannot quantify what you cannot see. Start with your "Crown Jewels": the 10% of assets that generate 90% of revenue.
Nation-state blindspots
Standard FAIR models struggle with "Black Swan" events. They rely on historical data, but nation-state attacks often use zero-day exploits with no history. You must overlay Scenario-Based Analysis for these high-impact, low-probability events.
The "so what?" gap
Finding a $5M risk number is useless if you don't connect it to a solution. A metric is only valuable if it changes a decision. Instead of saying "We have a $5M risk," say "We have a $5M risk. Implementing MFA will reduce this to $1M. The project costs $100k. The ROI is 40x."
2026 Strategy: How to build your "dollar-first" dashboard
Transitioning to CRQ is fully achievable if you stop trying to measure everything.
- Define Business Value (NIST CSF 2.0 - ID.AM): Map your IT assets to revenue streams using the NIST Asset Management category as a baseline. If the Order Processing System goes down, you lose $50k/hour. That is your baseline.
- Use "Cyber Value at Risk" (CyVaR): Create a single dashboard metric that answers: "How much money could we lose in the next 12 months?"
- Prioritize by ROI (NIST CSF 2.0 - GOVERN): Aligning with the new NIST Govern (GV) function, every patching decision must align with organizational strategy. Ask "Does this reduce our CyVaR?" If the answer is no, move it to the backlog.
Stop guessing. Start calculating.
Ready to build a board-ready risk model?
Get a free CRQ assessment with Precursor today.